With the election season upon us, some Americans will rediscover, as they do every four years, that there are far more people on the ballot than the president and their members of Congress. It is well known that voter turnout for local elections tends to be very low, especially when such events are not tied to a presidential ballot.
However, what is less appreciated is that even those who do turn out to vote for local offices frequently lack any real choices. As in, literally, there is only one candidate on the ballot.
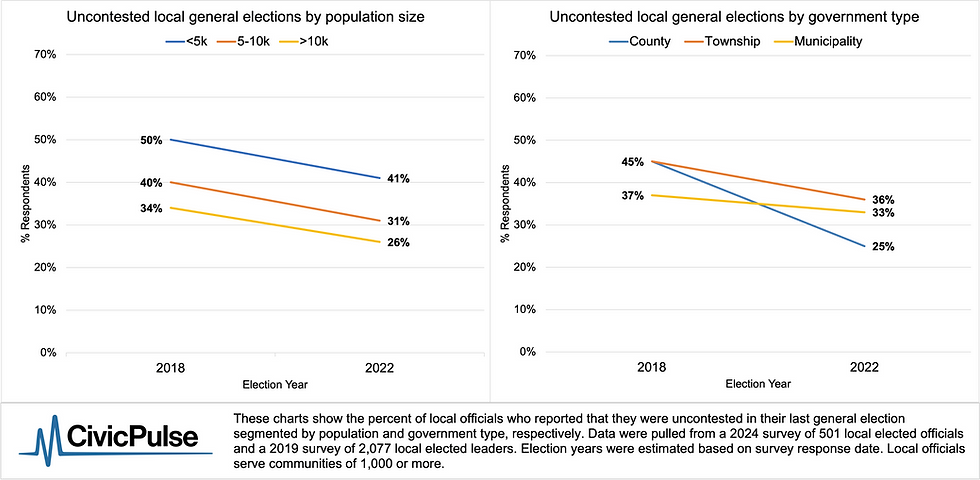
Based on CivicPulse’s best estimate, 34% of all county, township, and municipal general elections for governing board and top executive positions were uncontested in 2022. This finding is based on a 2024 representative survey of local officeholders, conducted in partnership with Professor Curtis Bram at the University of Texas at Dallas.
A Trend in the Right Direction?
This isn’t the first time we’ve asked local elected leaders about whether they faced a competitor. We compared this 34% number to our best estimate for 2018 based on a similar 2019 survey. In that survey, we found the rate of uncontested local general elections to be 42%.
In other words—though we don’t have data on the years in between—this does suggest the picture has improved in recent years. In fact, this downward trend in uncontested races holds both across community population size and government type.

We also compared our survey data on local elections with data on elections for state legislative elections in 2018 and 2022, as well as congressional elections for both years in both the Senate and House of Representatives. In 2022, the rate of uncontested general elections was similar between local and state elections, though in 2018 the rate was significantly higher for local. In both years, the rate of uncontested elections for both local and state races was much higher than for Congressional races.

Factors Contributing to Uncontested Elections
A variety of factors may contribute to the high prevalence of uncontested local elections. To begin with, general participation in local politics is notoriously low. For example, municipal elections see less than 15% turnout, according to Mona Chalabi and the Carnegie Corporation of New York. Voting, in many ways, is a "lower bar” for political participation. If this bar is not met for so many, it is hardly surprising that running for local office would be something still fewer would consider.
The demise of local news has certainly not helped either. In recent years, local newspapers have experienced an alarming decline in circulation and advertising revenue. There is some evidence that this trend has led to reduced political competition in mayoral races.
And some of the poor turnout in local elections is not an accident. Research compiled by MIT’s Election Data + Science Lab found that political parties and interest groups may manipulate local election scheduling to take advantage of lower turnout levels.
Finally, geographic partisan sorting—where most residents are ideologically similar within their communities—plays a role too. In work from our own team in the past, we have shown that individuals considering running for office against an ideological opponent are less likely to do so if they think their odds of winning are low.
Backgrounds of Local Elected Officials
Our survey also gathered data on respondents’ prior work industries and tenure lengths, providing insights into the backgrounds of those holding local offices. Prior government experience topped the rankings of past industries for local elected leaders with nearly half (45%) of local elected officials holding another government job prior to their current position.
The prominence of local leaders with prior government experiences reflects our findings from 2017, where past government experience also ranked higher than other past industries for elected officials. Furthermore, the top three past industries among officials in both surveys—government, education, and the community service/nonprofit sector—reflect a common motivation to serve the community.
Driven by their devotion and potentially influenced by the absence of competitive elections, many local officials demonstrate a strong willingness to remain in office. For example, 37% of officials reported staying in the same position for over 10 years and more than a fifth (22%) of said they have been in their position for 15 years or longer. Some officials even mentioned tenures ranging between 30 and 50 years. The official who self-reported the longest term has filled an unpaid position for just under 50 years – emphasizing the unique dedication that officeholders commit to supporting their communities.
More Research Coming on This
Why might things have improved since 2018? Is it a trend or just a blip? What will contestation in 2024 look like? Stay tuned! We have more research to come on this topic, and please don’t hesitate to send us comments, questions, or suggestions in the meantime.
Survey Background
This research brief builds upon data gathered from a nationally representative survey of 501 policymakers from local governments (i.e., township, municipality, and county governments) with a population of 1,000 or more. The survey was developed in collaboration with Dr. Curtis Bram at the University of Texas at Dallas and was implemented by CivicPulse.
Below is the question wording for the survey items that were used:
In my last general election, I won by:
More than 30%
20%-29%
10%-19%
5%-9%
Less than 5%
I did not face a contested election
Results referencing 2018 local elections (estimated year) come from our 2019 omnibus survey of 2,077 policymakers from local governments (i.e., township, municipality, and county governments) with a population of 1,000 or more.
Below is the question wording for the survey items that were used:
When you last ran for office, did you face an opponent in the general election?
Yes
No
Other (fill in:)
Press Contact:
Nathan Lee, PhD
Managing Director